Pulse Check

I’m not a medical doctor, but I suspect most of you have had a conversation with your primary care physician over the last few years about the need to maintain a healthy lifestyle. Whether that’s exercising more, eating better, wearing smartwatches, rings, or biosensors to measure daily steps, heartrate, sleep patterns, etc., the goal is the same – to assess whether you are staying healthy. Most importantly, consistent effort—not one-time fixes—leads to better longevity and health!
The same is true for our organizational “health.”
We need to measure how healthy we are – on a regular basis – to ensure we have a shot at achieving the many outcomes we are working toward on behalf of the American people. That measurement is our quarterly pulse survey. It’s intended to give us an ongoing snapshot about whether we are focused on the right objectives (and everyone in fact knows what their objectives are in relation to our organizational objectives), are we managing the organization to create accountability and reward outstanding performance, and whether we are upholding the cultural values to which we ascribe.
So, how are we doing?
Let’s start with a quick reminder about what we are focused on – I hope (!) none of this comes as a surprise.
· Getting the right talent in the right seats. OPM needs to help ourselves and the rest of government recruit, incent, and retain our fundamental asset – people. We have a particular focus on a number of things here:
o Early career – trying to address the pan-government challenge of only 7% of our workforce being early career (compared with 22% in the total US workforce)
o X-Government hiring – improving the applicant experience and the overall efficiency of hiring by using pooled hiring/common certificates for jobs that are represented across multiple agencies
o Merit hiring – getting away from candidate self-attestation of skills and replacing that with more formal assessments that test the specific skills needed for a specific role
· Creating a high-performance culture
o Recognizing when employees consistently go above and beyond through our annual ratings system, rewards, and potential promotion opportunities
o Improving accountability for under-performing employees
· Being good stewards of taxpayer dollars
o Within OPM itself and across government, that means looking at technology modernization, organizational and process changes, and re-prioritization (and even elimination) of what things we work on and how best to staff them
Underlying all of these are the cultural values that we act on:
· Asking why – how something has been done is not necessarily how something should be done going forward
· Teams beat individuals – we will succeed only if we work effectively together, both within our teams and across OPM
· “Other People’s Money” – we are stewards of taxpayer dollars and will act that way in how we deliver on behalf of the American people
· Customer-first – we will not be “No”PM, but rather “Go”PM: our job is to help other agencies achieve their objectives
· Embracing “measured” risk – balancing the downside risks of moving forward with imperfect information with the upside benefits of keeping the trains moving
Ok, let’s get to the results of our pulse survey.
By the way, the absolute scores themselves are less relevant (they’re just not that precise as a point-in-time reading); rather, the trends and ordinal ranking of the responses matter more. What we really want to see is: Are we focused on the things that matter most, are we making progress in the areas that are not up to par, and do we have significant variances across departments and managers that require intervention?
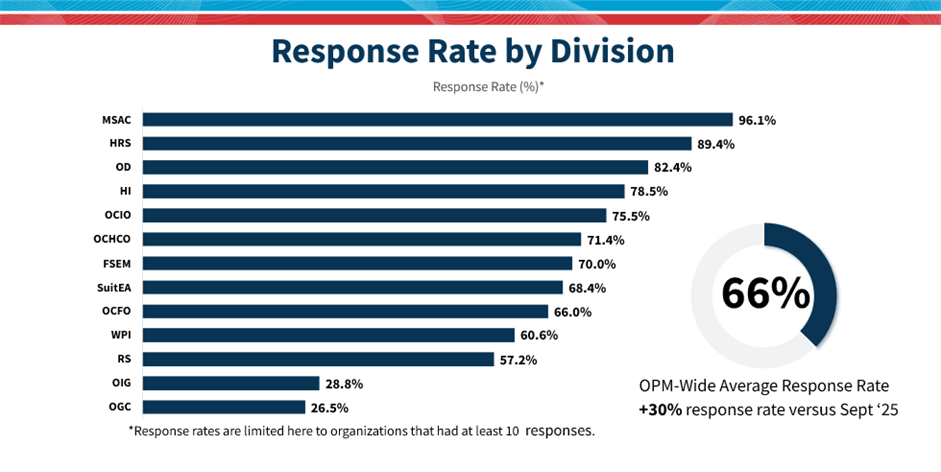
I am grateful to everyone at OPM who took the time to complete the survey – I promised it would only take a few minutes to complete (and hope you found it that way). Overall, we had a 66% response rate, which is really good for any survey. For comparison, we were only at about 36% when we did the last one! Thank you for taking the time; it’s critical we get enough representation to draw meaningful conclusions.
Below you can see a graphic of the response rates by function. Still some work to do, but overall positive.
Now on to the key results.
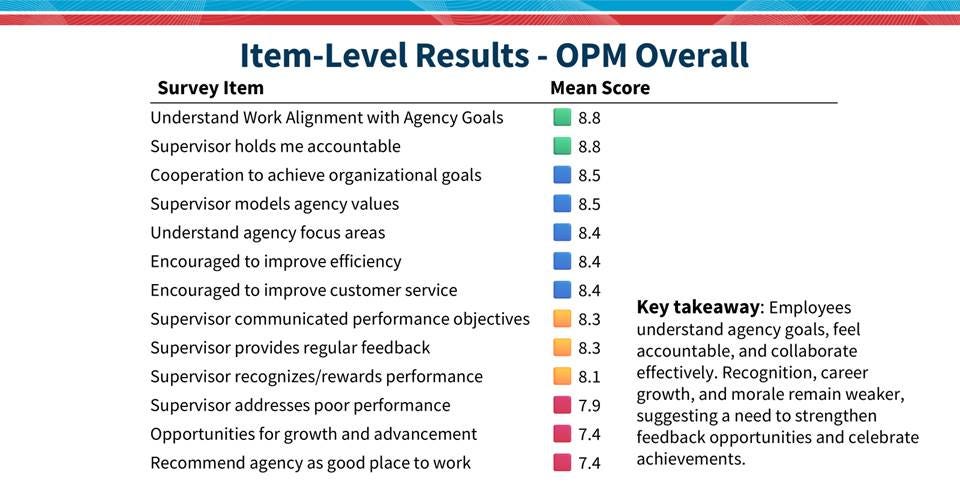
Positive takeaways:
· The scores highlighted in green and blue are very good. They suggest we are doing well at making sure everyone knows what we are supposed to be focused on as an organization and that most employees understand how their work relates to those goals. That’s important – we want everyone rowing in the same direction (and if you don’t know the right direction, it’s pretty hard to do that!).
· The data also suggests we’re doing well at upholding our cultural objectives. Specifically, we want our culture to reinforce the following actions: (1) Being stewards of taxpayer dollars (efficiency; “OPM”); (2) Putting the customer first (customer service); and (3) Winning as a team (collaboration).
What do we need to work on? The yellow and red highlights demonstrate that:
· Performance management and building a high-performance culture – we definitely have room for improvement here.
o Every supervisor in OPM should be providing regular feedback to team members (we can’t show up once per year in September at performance review time and expect that to be sufficient).
o We also need to work on accountability. This is not about being callous and firing underperforming employees, but rather about giving feedback to team members who are not meeting the mark, putting clear and actionable performance improvement plans in place and ultimately making changes to the extent these employees are not able to improve. It’s only fair to the vast majority of team members who show up to work every day, working diligently on behalf of the American people.
o On the other end of the spectrum, we also need to reward and recognize those team members who consistently knock the cover off the ball! A high-performance culture is not just about accountability for under-performers, but also about differentiating between employees who go above and beyond.
I mentioned above that the direction of the data over time is more important than the point-in-time results. So, let’s take a look at that in the following graphic.
The yellow box underscores what the point-in-time data illustrate. We still have lots of work to do to get to the high-performance culture to which we aspire.
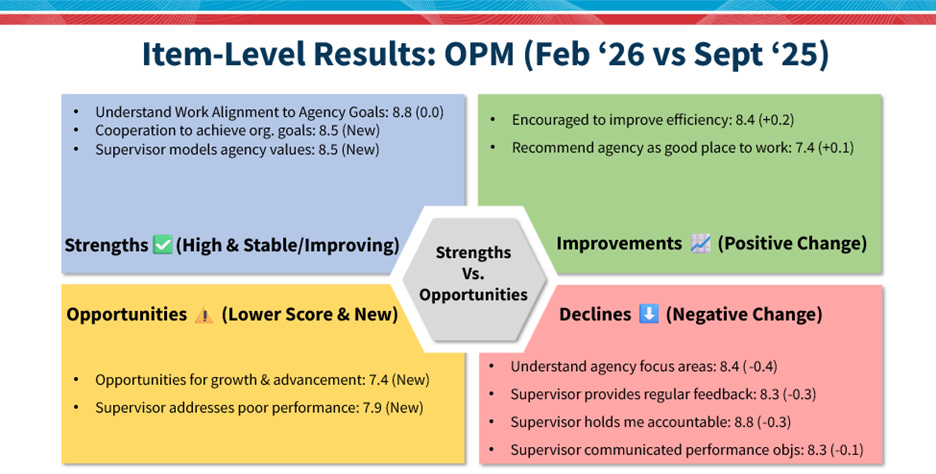
While the red box shows areas that have declined since our last survey, I am less concerned (for now) about that since the absolute values and the ordinal ranking of those answers are still fairly high. This is something we will keep an eye on over the next few surveys to see whether this was a blip or the canary in the coalmine of something more serious.
Getting to where we want to be is a marathon, not a race. (And, for those of you following last week’s news at the Los Angeles Marathon (which I had the pleasure of running twice), there will be no medals awarded at Mile 18!)We need to pace ourselves, measure our progress, and course-correct along the way—using regular pulse checks to make sure we’re on track. And of course, stay hydrated!